
Fishes are incredibly diverse, fill various roles in their ecosystems, and are an important resource—economically, socially, and nutritionally. The relationship between primary productivity and fish catches is not straightforward; fisheries oceanographers and managers have long struggled to predict abundances and fully understand the controls of cross-ecosystem differences in fish abundances and assemblages. A recent study in Progress in Oceanography modeled the relationships between fish abundances and assemblages and ecosystem factors such as physical properties and plankton productivity.
The mechanistic model simulated feeding, growth, reproduction, and mortality of small pelagic forage fish, large pelagic fish, and demersal (bottom-dwelling) fish in the global ocean using plankton food web estimates and ocean conditions from a high-resolution earth system model of the 1990s. Modeled fish assemblages were more related to the separation of secondary production into pelagic zooplankton or benthic fauna secondary production than to primary productivity. Specifically, the ratio of pelagic to benthic production drove spatial differences in dominance by large pelagic fish or by demersal fish. Similarly, demersal fish abundance was highly sensitive to the efficiency of energy transfer from exported surface production to benthic fauna.
The model results offer a systematic understanding of how marine fish communities are structured by spatially varying environmental conditions. With global climate change, the expected decrease in exported primary production would lead to fewer demersal fish around the world. This model provides a framework for testing the effect of changing conditions on fish communities at a global scale, which can also help inform managers of potential impacts on economic, social, and nutritional resources worldwide.
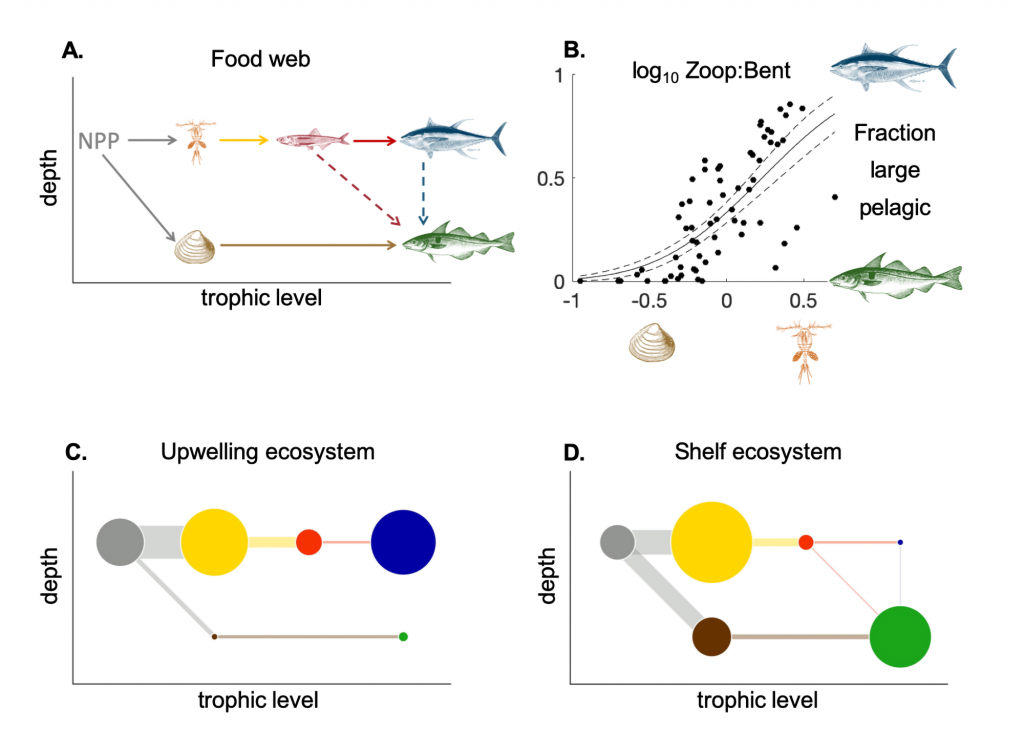
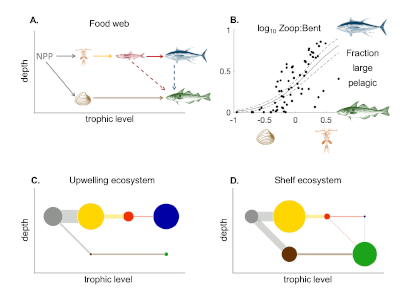
Figure 1: (A) Sample food web with three fish types, two habitats, two prey categories, and feeding interactions (arrows). Dashed arrow denotes feeding only occurs in shelf regions with depth <200 m. (B) Fraction of large pelagic vs. demersal fishes (LP/(LP+D)) as a function of the ratio of zooplankton production lost to higher predation (Zoop) to detritus flux to the seafloor (Bent) averaged over large marine ecosystems. Solid line: predicted linear model response, dashed lines: standard error. (Lower panels) Circles=mean biomasses (g m-2) and lines=fluxes of biomass (g m-2 d-1) through the pelagic (top 100m) and benthic components of the food webs at two test locations, (C) Peruvian Upwelling (PUP) ecosystem and (D) Eastern Bering Sea (EBS) shelf ecosystem. Circles and lines scale with the modeled biomasses and fluxes. Circle color key: Gray=net primary productivity (NPP); yellow=medium and large zooplankton; red=forage fish; blue=large pelagic fish; brown=benthos; green=demersal fish.
Authors:
Colleen M. Petrik (Princeton University, Texas A&M University)
Charles A. Stock (NOAA Geophysical Fluid Dynamics Laboratory)
Ken H. Andersen (Technical University of Denmark)
P. Daniël van Denderen (Technical University of Denmark)
James R. Watson (Oregon State University)

