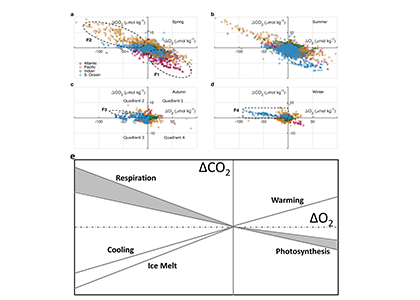
A recent study in Communications Earth & Environment, examined spatiotemporal patterns of the two dissolved gases CO2 and O2 in the surface ocean, using the high-quality global dataset GLODAPv2.2020. We used surface ocean data from GLODAP to make plots of carbon dioxide and oxygen relative to saturation (CORS plots). These plots of CO2 deviations from saturation (ΔCO2) against oxygen deviations from saturation (ΔO2) (Figure 1) provide detailed insight into the identity and intensity of biogeochemical processes operating in different basins.
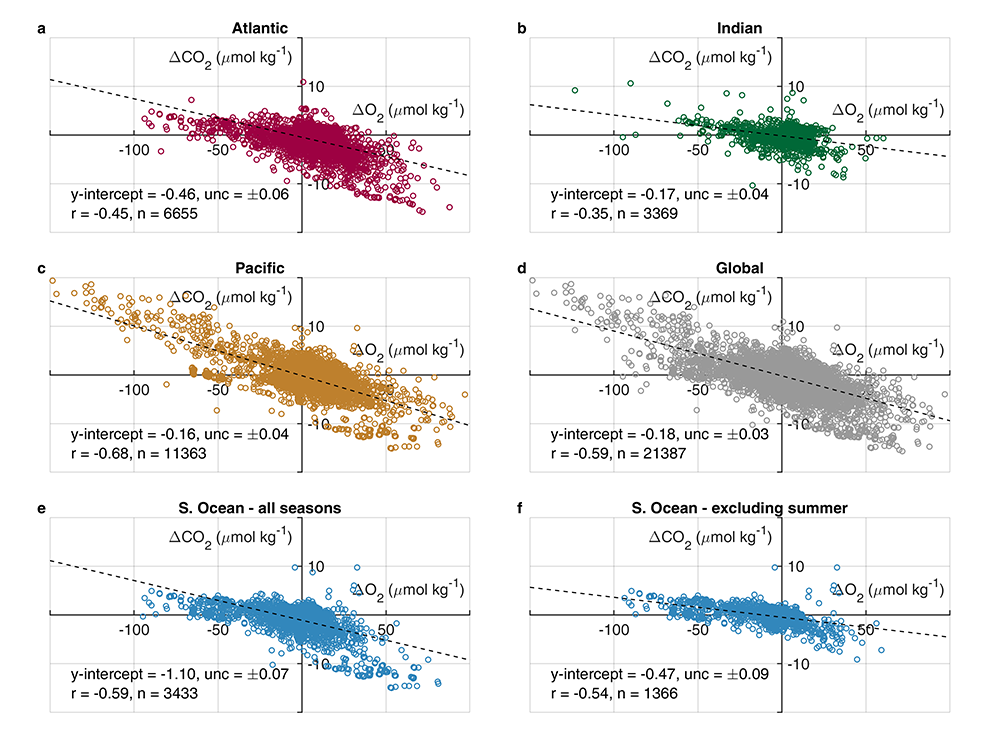
Figure 1: Relationships between ΔCO2 and ΔO2 in the global ocean basins based on surface data in the GLODAPv2.2020 database. The black dashed lines are the least-squares best-fit lines to the data; unc denotes the uncertainty in the y-intercept value with 95% confidence; r is the associated Pearson correlation coefficient; n is the number of data points.
In addition, data in all basins and all seasons shares some common behaviors: (1) negative slopes of best fit lines to the data, and (2) near-zero y-intercepts of those lines. We utilized these findings to compare patterns in CORS plots from GLODAP with those from BGC-Argo float data from the Southern Ocean Carbon and Climate Observations and Modeling (SOCCOM) program. Given that the float O2 data is likely to be more accurate than the float pH data (from which the float CO2 is calculated), CORS plots are useful for detecting questionable float CO2 data, by comparing trends in float CORS plots (e.g. Figure 2) to trends in GLODAP CORS plots (Figure 1). As well as the immediately detected erroneous data, we discovered significant discrepancies in ΔCO2-ΔO2 y-intercepts compared to the global reference (i.e., GLODAPv2.2020 y-intercepts, Figure 1). The y-intercepts of 48 floats with QCed O2 and CO2 data (at regions south of 55°S) were on average greater by 0.36 μmol kg−1 than the GLODAP-derived ones, implying the overestimations of float-based CO2 release in the Southern Ocean.
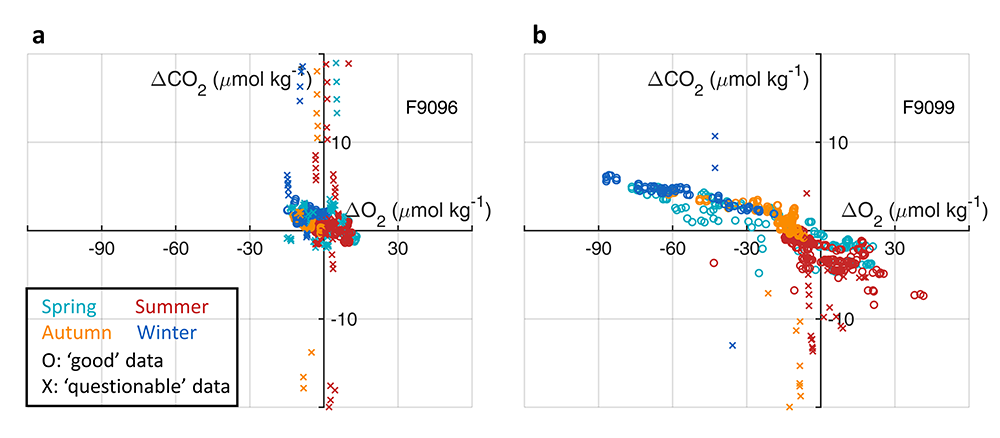
Figure 2. CORS plots from data collected by SOCCOM floats F9096 and F9099 in the high-latitude Southern Ocean. Circles with solid edges denote data flagged as ‘good’, whereas crosses denote data flagged as ‘questionable’.
Our study demonstrates CORS plots’ ability to identify questionable data (data shown to be questionable by other QC methods) and to reveal issues with supposed ‘good’ data (i.e., quality issues not picked up by other QC methods). CORS plots use only surface data, hence this QC method complements existing methods based on analysis of deep data. As the oceanographic community becomes increasingly reliant on data collected from autonomous platforms, techniques like CORS will help diagnose data quality, and immediately detect questionable data.
Authors:
Yingxu Wu (Polar and Marine Research Institute, Jimei University, Xiamen, China; University of Southampton)
Dorothee C.E. Bakker (University of East Anglia)
Eric P. Achterberg (GEOMAR Helmholtz Centre for Ocean Research Kiel)
Amavi N. Silva (University of Southampton)
Daisy D. Pickup (University of Southampton)
Xiang Li (George Washington University)
Sue Hartman (National Oceanography Centre, Southampton)
David Stappard (University of Southampton)
Di Qi (Polar and Marine Research Institute, Jimei University, Xiamen, China)
Toby Tyrrell (University of Southampton)