
Phytoplankton are small, drifting photosynthetic organisms that form the base of marine food webs and play an important role in carbon and nutrient cycling. Analyses of how they vary in space and time (through variables like the concentration of pigment chlorophyll-a, a proxy for their biomass) are therefore important. Because phytoplankton drift with ocean currents, their variability and rates of change should be analyzed in a Lagrangian frame (observer moves with a water parcel) as opposed to an Eulerian frame (observer is fixed in space). However, Lagrangian observations are less available and it is difficult to separate the effects of physical and biological processes in Eulerian observations.
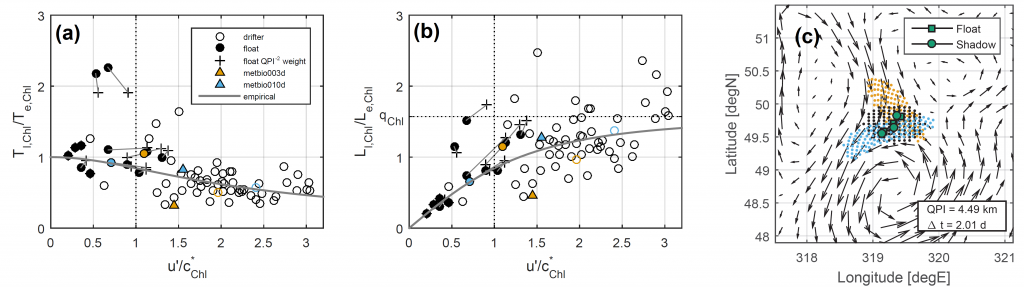
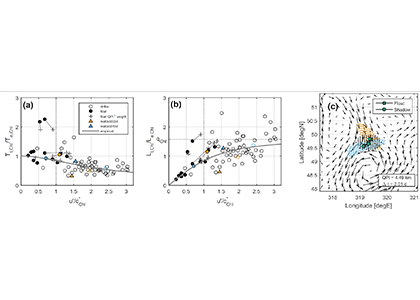
Figure 1: The decorrelation time and length scales of chlorophyll-a in the Lagrangian (Tl,Chl and Ll,Chl) and Eulerian (Te,Chl and Le,Chl) frames are related by the underlying mesoscale velocity field. (a) Ratio Tl,Chl / Te,Chl as a function of u’ / c*Chl computed from anomalies relative to a climatology, where u’ is a scale for the mesoscale eddy velocities and c*Chl = Le,Chl / Te,Chl is an evolution speed for the chlorophyll field. (b) As in (a) but for ratio of length scales, Ll,Chl / Le,Chl. In (a) and (b), hollow (filled) circles come from all surface drifters (all BGC-Argo floats) in a 5º x 5º bin and crosses weight the float-derived scales by the inverse square of a Quasi-Planktonic Index (so that float segments more similar to a surface trajectory count more; see below). Triangles come from two floats that profiled frequently. Solid line is an empirical curve: as u’ / c*Chl → ∞, Lagrangian decorrelation is entirely determined by Fickian diffusion and the ratio of length scales approaches qChl = π/2. (c) Example demonstrating the Quasi-Planktonic Index (QPI), which quantifies the average distance between a float (squares) and the best-fit synthetic trajectory generated from surface currents (circles). Altimetric geostrophic currents are shown as vectors, initial particle locations are black dots, and final forward (backward) particle locations are blue (orange) dots. A smaller QPI indicates a float segment more similar to a surface geostrophic trajectory.
A recent study used observations of chlorophyll-a concentration in the upper ocean from satellites and BGC-Argo profiling floats to quantify the statistics of phytoplankton (time and length scales obtained from autocorrelation functions) in the Lagrangian and Eulerian frames and to understand how the two frames are related by the underlying velocity field. At the mesoscale (the size of swirling, balanced flows), the Eulerian scales of chlorophyll-a anomalies relative to a seasonal cycle matched those of velocity, suggesting ocean dynamics play a role in setting phytoplankton scales. The ratio of Lagrangian to Eulerian length scales of chlorophyll depends on the magnitude of turbulent velocity fluctuations relative to how fast the chlorophyll field translates, following an empirical curve with an asymptotic limit consistent with stirring by mesoscale eddies (Figure 1a,b). They conclude that when velocity fluctuations are relatively large, turbulent diffusion drives decorrelation, but when they are relatively small, biological sources drive decorrelation.
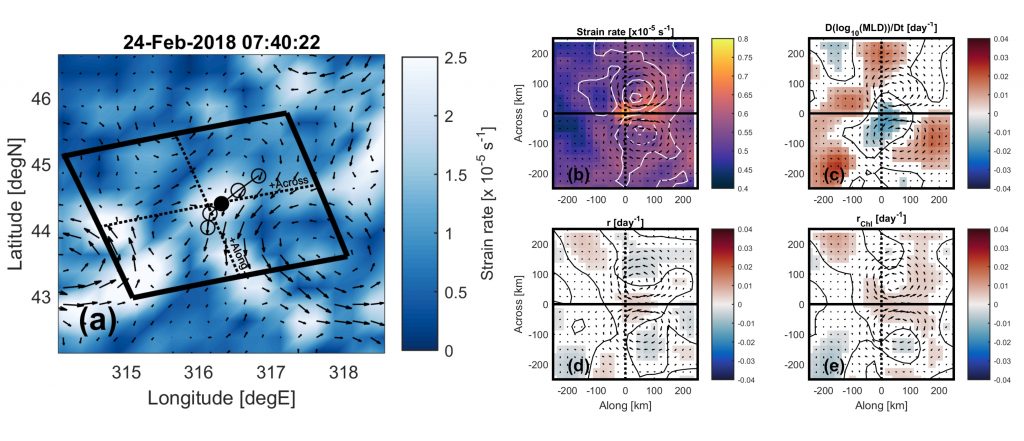
Figure 2: A composite view of the physical and biological processes at mesoscale ocean fronts. (a) Example of a straining maximum in altimetric geostrophic currents and rotated coordinate system, along with a coincident float trajectory. Lagrangian time series from 18 floats in the North Atlantic are matched to all straining maxima and averaged in rotated coordinates, utilizing only profiles where the Quasi-Planktonic Index (QPI) is less than 5 km; (b) strain rate (color) and relative vorticity (contours); (c) time derivative of mixed layer depth; (d) phytoplankton accumulation rate; (e) chlorophyll-a accumulation rate. Fronts are characterized by a shoaling mixed layer and increasing chlorophyll-a over the front.
Finding that floats can sample a mixed layer tracer somewhat like a surface Lagrangian observer when their trajectory is similar to a surface trajectory (Figure 1c), the authors conducted a follow-up study where they used floats under those conditions to better understand the biological-physical interactions at straining fronts, which are regions between mesoscale eddies where lateral gradients are sharpened, force balances break down, and episodic vertical velocities may be important for mixed layer budgets of carbon and nutrients. By averaging rates of phytoplankton accumulation (from the along-track derivative of mixed-layer averaged chlorophyll-a) in coordinates aligned with ocean fronts, they found that these dynamical structures are characterized by a shoaling mixed layer and increasing phytoplankton carbon and chlorophyll (Figure 2). They conclude that the vertical motions at ocean fronts restratify the mixed layer which increases average light levels experienced by cells, accelerating division rates and causing their accumulation.
The results of these studies provide important insights into the space-time evolution of reactive tracers like chlorophyll-a in a mesoscale flow. The results also provide insight into how to interpret time series obtained from BGC-Argo floats, which are observing platforms that are neither Lagrangian nor Euleran, and highlight floats’ potential to address problems of biological-physical interactions under certain sampling conditions.
Authors:
Darren C. McKee (University of Virginia, USA)
Scott C. Doney (University of Virginia, USA)
Alice Della Penna (University of Auckland, NZ)
Emmanuel S. Boss (University of Maine, USA)
Peter Gaube (University of Washington, USA)
Michael J. Behrenfeld (Oregon State University, USA)
David M. Glover (Woods Hole Oceanographic Institution, USA)

